Pyramid Charts are a popular tool for data visualization, but they also have their drawbacks. Keep reading to learn about the pros and cons of using pyramid charts.
Best Practices for Pyramid Chart Design
Pyramid charts are a type of chart that display hierarchical data in a triangular structure. They can be used to show the relative sizes or proportions of different parts of a whole or to compare and contrast items. There are several advantages and disadvantages of a pyramid chart.
Pros
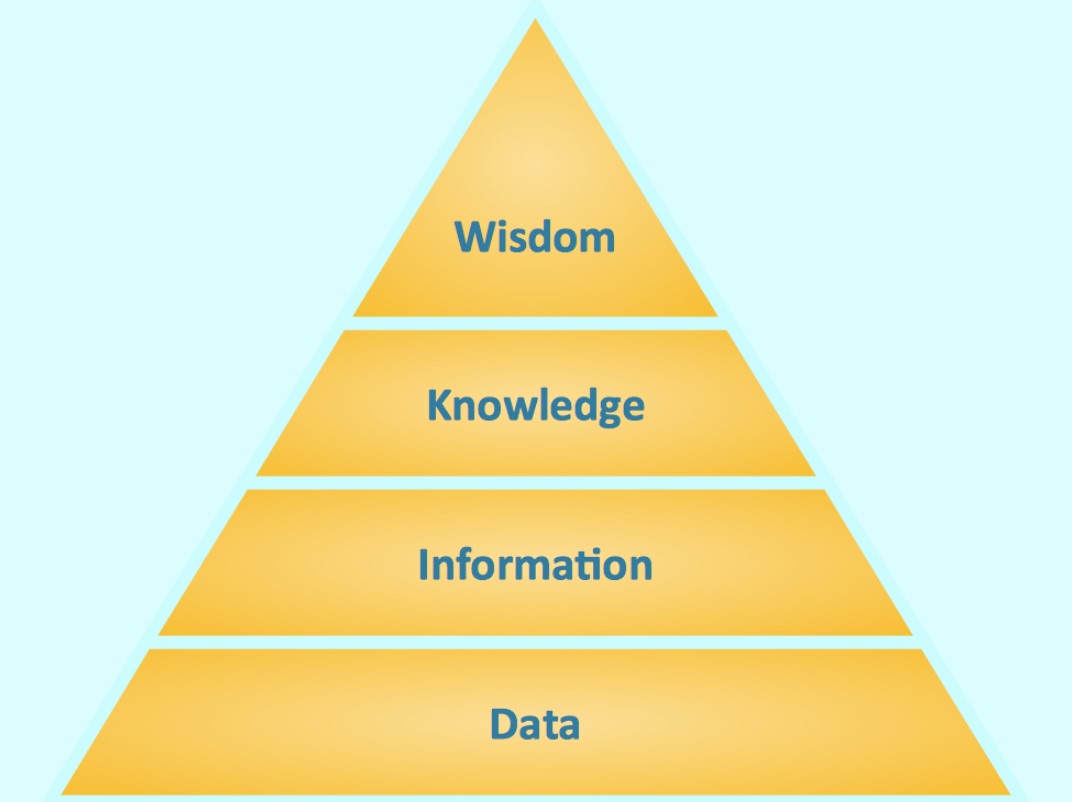
Pyramid charts are very effective at displaying hierarchical data, which is information that can be organized into levels or ranks. The triangular structure makes it easy to see the relative size or proportion of each part of the whole. They can also be used to compare and contrast items, which is useful when you want to see how one thing differs from another.
Pyramid charts are relatively easy to create and understand.
Cons
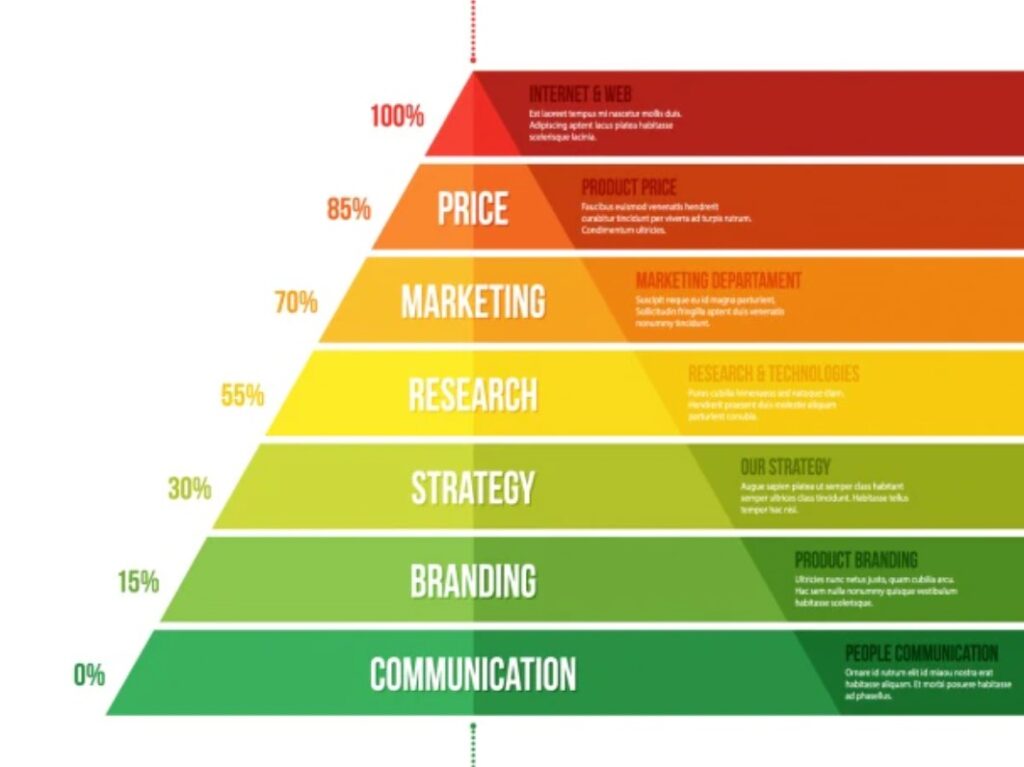
Pyramid charts can be confusing if there are too many levels in the pyramid because it can be difficult to track down which line corresponds with which item. It may also be difficult to determine the value represented by a given point on the pyramid chart.
The Pros of Pyramid Charts

Pyramid charts are a type of data visualization chart that displays data as a pyramid. The base of the pyramid is the largest group, and each successive level is smaller than the one before it. This type of chart can be used to compare different groups or to show changes over time. There are several pros to using pyramid charts.
First of all, they’re easy to read. The large base at the bottom makes it easy to see the largest group, and each subsequent level is smaller, making it easy to see changes over time. Pyramid charts are also eye-catching and memorable. Additionally, they can be used to compare different groups. For example, you could use a pyramid chart to compare how many men versus women work in different industries. Pyramid charts can also be used to show changes over time.
Tips for Creating Effective Pyramid Charts

There are several things to keep in mind when creating pyramid charts. First, make sure the data is easy to read. Use different colors or shades of gray to indicate the relative size of each group. Also, be sure that the largest group is at the top and the smallest group is at the bottom. This will ensure that your chart is visually appealing and easy to understand. Lastly, label each group so that viewers know what they’re looking at.
Other Drawbacks of a Pyramid Chart
Although pyramid charts are useful for displaying data that has many levels of hierarchy, such as an organization’s structure or product categories, there are still several disadvantages to using this kind of chart.
One major disadvantage is that pyramid charts can be difficult to read because they are not as concise as other types of charts. Another disadvantage is that they can be misleading because they run the risk of making data appear more important than it actually is. For example, if the top category in a pyramid chart contains a small amount of data, it will have a large impact on the overall chart, even though it may not be significant when compared to the data in other categories. Additionally, pyramid charts can be confusing for viewers who are just not familiar with their structure.
Overall, pyramid charts are useful because they provide a visual representation of the relative importance of data points. This can be helpful in determining how to allocate resources or in making other important decisions. Clearly, pyramid charts are a valuable tool for data analysis.
